Analysis of Monday's Trades
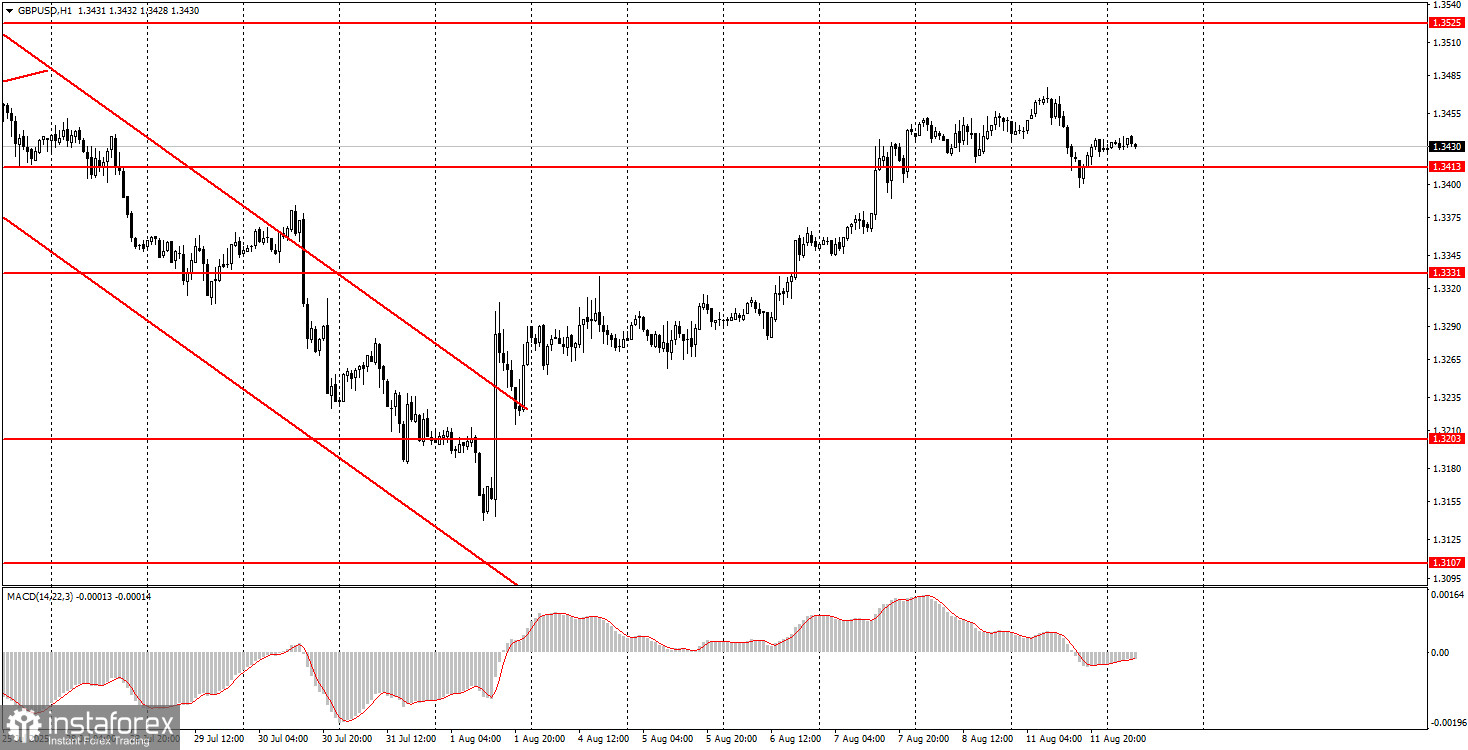
1H Chart of GBP/USD
The GBP/USD pair also declined slightly on Monday, but the strengthening of the dollar means nothing. The price did not even manage to consolidate below the nearest level of 1.3413. Therefore, the upward movement may resume as early as today. It is worth noting that both the UK and the US will release important reports today, so the price could change direction several times during the day. For example, British reports still offer little reason to expect strong results. Despite the British pound's confident growth over the past six months, this is not due to its own merits — it is the US dollar that has been falling for half a year under the influence of Donald Trump's policies. If the US currency had not been depreciating so rapidly, the pound would never have shown such growth based on UK macroeconomic data. As for the US inflation report, it will most likely show an increase, which could theoretically weaken the market's dovish expectations. However, the Federal Reserve is almost certain to cut the key rate in September, so this report will have no real impact.
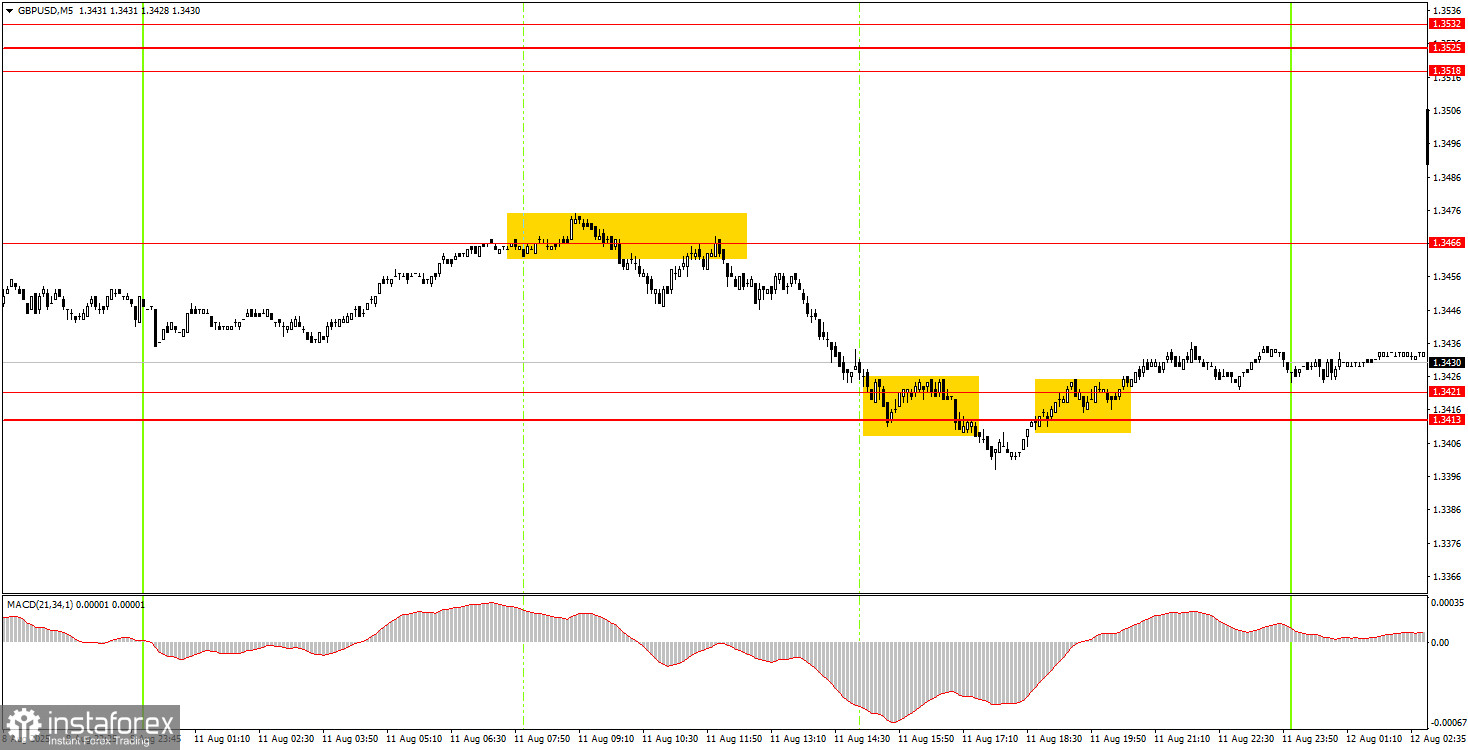
5M Chart of GBP/USD
On the 5-minute timeframe on Monday, several trading signals were formed. During the European trading session, the price rebounded twice from the 1.3466 level, which can now be adjusted to include 1.3475. After that, the price fell to the 1.3413–1.3421 area and even broke through it, but could not continue moving south. A consolidation above this area allowed novice traders to close short positions in profit.
Trading Strategy for Tuesday:
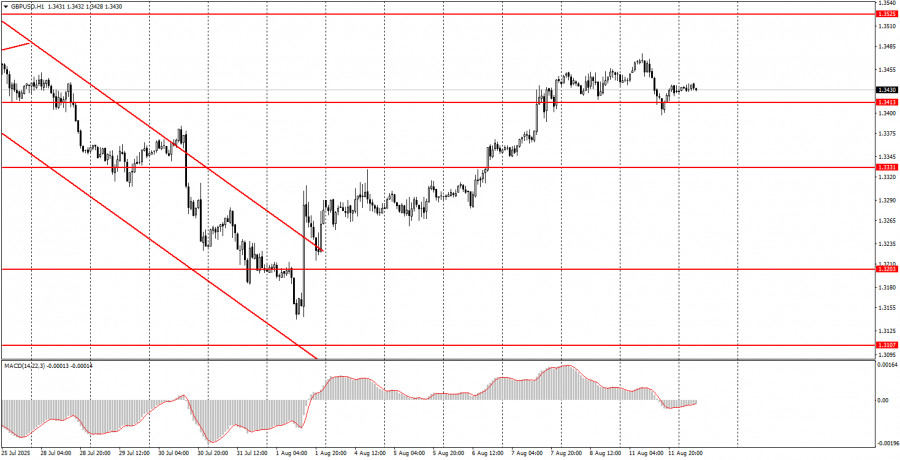
On the hourly timeframe, GBP/USD indicates that the downward trend has ended. Based on the events of the past two weeks, we would not bet even a penny on the growth of the US currency. While the market is in no hurry to sell the dollar aggressively, the US currency continues to decline steadily and regularly. A breakout above the descending channel has been completed, so the trend on the hourly chart has shifted to bullish.
On Tuesday, GBP/USD may resume its upward movement after Monday's "pause." Therefore, any support level is potentially an area for a rebound and a continuation of the move north. A rebound from the 1.3413–1.3421 area could trigger another upward wave, which could be traded with long positions. A break below this area would open the way for short positions targeting 1.3329–1.3421.
On the 5-minute timeframe, trading can now be based on the following levels: 1.3102–1.3107, 1.3203–1.3211, 1.3259, 1.3329–1.3331, 1.3413–1.3421, 1.3466–1.3475, 1.3518–1.3532, 1.3574–1.3590, 1.3643–1.3652, 1.3682, 1.3763.
For Tuesday, the UK is scheduled to publish reports on unemployment, jobless claims, and wages. In the US, the key inflation report will be released.
Core Trading System Rules:
- Signal Strength: The shorter the time it takes for a signal to form (a rebound or breakout), the stronger the signal.
- False Signals: If two or more trades near a level result in false signals, subsequent signals from that level should be ignored.
- Flat Markets: In flat conditions, pairs may generate many false signals or none at all. It's better to stop trading at the first signs of a flat market.
- Trading Hours: Open trades between the start of the European session and the middle of the US session, then manually close all trades.
- MACD Signals: On the hourly timeframe, trade MACD signals only during periods of good volatility and a clear trend confirmed by trendlines or trend channels.
- Close Levels: If two levels are too close (5–20 pips apart), treat them as a support or resistance zone.
- Stop Loss: Set a Stop Loss to breakeven after the price moves 20 pips in the desired direction.
Key Chart Elements:
Support and Resistance Levels: These are target levels for opening or closing positions and can also serve as points for placing Take Profit orders.
Red Lines: Channels or trendlines indicating the current trend and the preferred direction for trading.
MACD Indicator (14,22,3): A histogram and signal line used as a supplementary source of trading signals.
Important Events and Reports: Found in the economic calendar, these can heavily influence price movements. Exercise caution or exit the market during their release to avoid sharp reversals.
Forex trading beginners should remember that not every trade will be profitable. Developing a clear strategy and practicing proper money management are essential for long-term trading success.