Wednesday Trade Review:
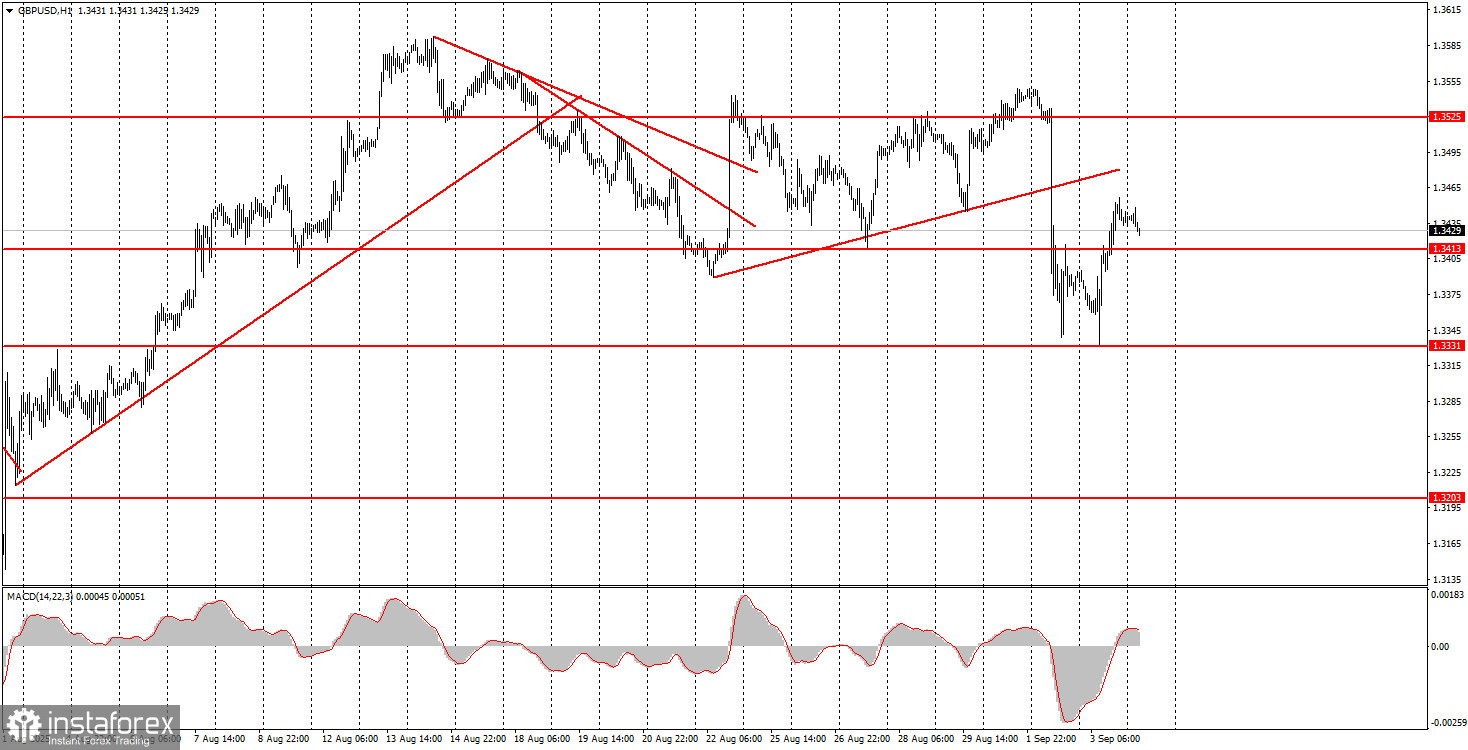
1H Chart of GBP/USD
On Wednesday, the GBP/USD pair traded higher. Recall that on Tuesday, British currency quotes plummeted sharply—a move many experts explained by the rise in UK government bond yields. We consider this a valid reason, but at the same time, remind you that US bond yields are also rising. And rising yields mean increased pressure on any budget. Thus, the rise in yields in the UK is alarming for both the British economy and the pound, but the situation in the US is no better.
There were no macroeconomic events scheduled this week in the UK, while in the US, yesterday's JOLTs job openings report for July was released. It turned out that the number of job openings fell from 7.357 million to 7.181 million, while forecasts were above 7.4 million. Thus, the US labor market continues to shrink, which is unlikely to please USD bulls. Of course, Friday's labor market and unemployment reports may turn out stronger than forecasts, but overall, the deteriorating trend is clearly visible.
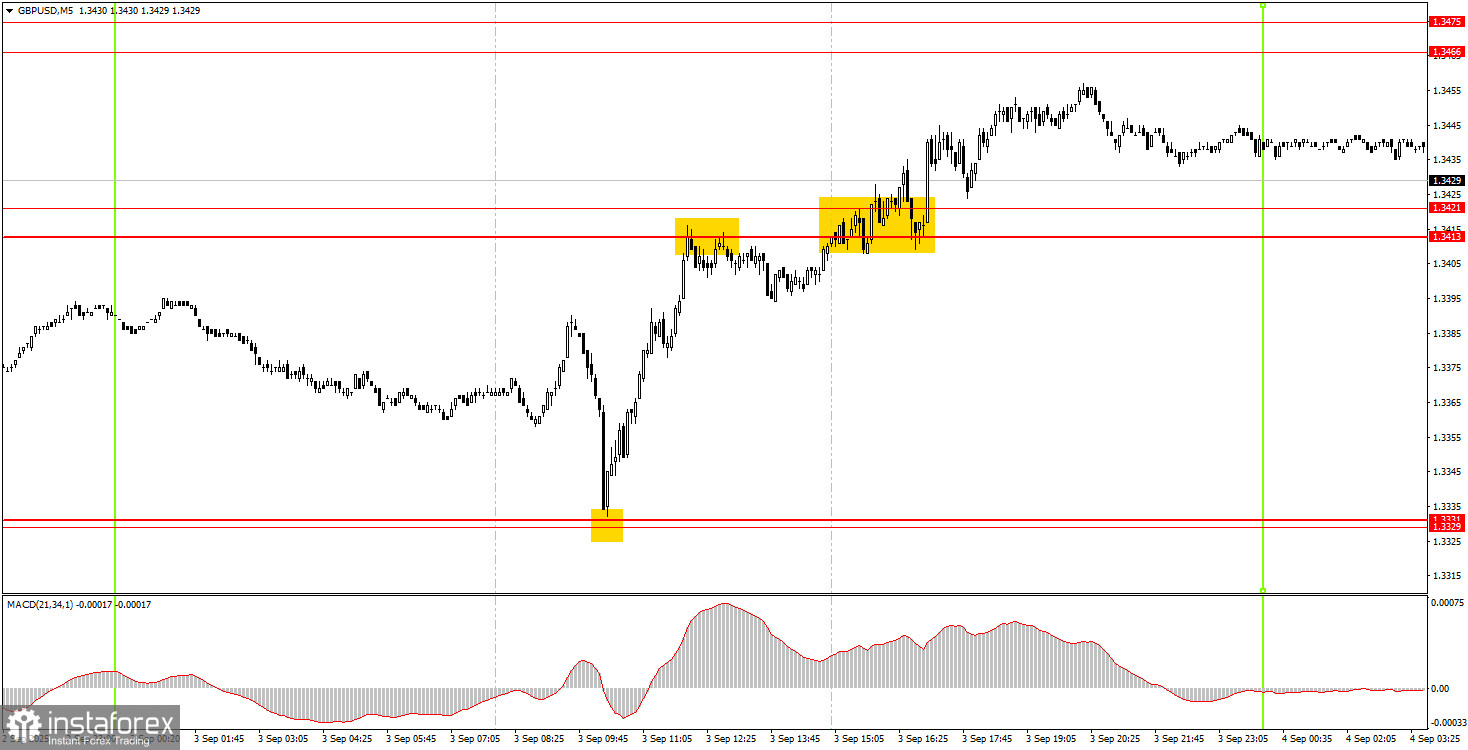
5M Chart of GBP/USD
On the 5-minute timeframe, several very solid trading signals were formed on Wednesday. The first buy signal in the 1.3329–1.3331 area allowed novice traders to make a solid profit on a long position. The price rose literally within an hour to the 1.3413–1.3421 area, from which it initially rebounded. At this point, novice traders could have closed longs and opened shorts. The sell signal turned out to be false and was canceled an hour later—the price consolidated above the 1.3413–1.3421 area, allowing new, also profitable longs. All in all, about 50–60 pips could have been earned on three trades on Wednesday.
How to Trade on Thursday:
On the hourly chart, the GBP/USD pair showed a willingness to continue the global downward correction. The fundamental and macroeconomic background hasn't become more attractive for the dollar lately, so we still don't expect a strong USD rally. However, the short-term trend on the hourly timeframe is downward again, so short positions can be considered.
On Thursday, the GBP/USD pair may continue to move upward since yesterday it broke through the 1.3413–1.3421 area. If the price bounces from this area today, longs can be opened, aiming for 1.3466–1.3475. A consolidation below the 1.3413–1.3421 area will allow short positions with a target of 1.3329–1.3331.
On the 5-minute timeframe, you can currently trade at levels: 1.3102–1.3107, 1.3203–1.3211, 1.3259, 1.3329–1.3331, 1.3413–1.3421, 1.3466–1.3475, 1.3518–1.3532, 1.3574–1.3590, 1.3643–1.3652, 1.3682, 1.3763. On Thursday, no important UK reports are scheduled again, while in the US, the important ISM Services PMI will be released. Recall that the similar PMI for manufacturing already disappointed earlier this week.
Core Trading System Rules:
- Signal Strength: The shorter the time it takes for a signal to form (a rebound or breakout), the stronger the signal.
- False Signals: If two or more trades near a level result in false signals, subsequent signals from that level should be ignored.
- Flat Markets: In flat conditions, pairs may generate many false signals or none at all. It's better to stop trading at the first signs of a flat market.
- Trading Hours: Open trades between the start of the European session and the middle of the US session, then manually close all trades.
- MACD Signals: On the hourly timeframe, trade MACD signals only during periods of good volatility and a clear trend confirmed by trendlines or trend channels.
- Close Levels: If two levels are too close (5–20 pips apart), treat them as a support or resistance zone.
- Stop Loss: Set a Stop Loss to breakeven after the price moves 20 pips in the desired direction.
Key Chart Elements:
Support and Resistance Levels: These are target levels for opening or closing positions and can also serve as points for placing Take Profit orders.
Red Lines: Channels or trendlines indicating the current trend and the preferred direction for trading.
MACD Indicator (14,22,3): A histogram and signal line used as a supplementary source of trading signals.
Important Events and Reports: Found in the economic calendar, these can heavily influence price movements. Exercise caution or exit the market during their release to avoid sharp reversals.
Forex trading beginners should remember that not every trade will be profitable. Developing a clear strategy and practicing proper money management are essential for long-term trading success.