The GBP/USD currency pair moved on Thursday in a way that made you want to cry again. The more or less stable and attractive British pound is also beginning to disappoint traders with its convulsions, called "moves." In the EUR/USD article, we already examined in detail why you should not try to explain every move, report, or event. Our explanations work equally well for the GBP/USD pair.
Yesterday morning, the UK released GDP and industrial production reports for November. For the first time in a long while, both reports were significantly stronger than forecasts, which should have triggered a rise in the pound. Of course, we saw no such rise. Intraday, the pair rose by (laughably) 15 pips, only to lose them over the next half hour. If 15 pips is the reaction to two strong reports, then perhaps we do not understand something.
A similar situation occurred the day before. At least two fairly positive US reports were released for the dollar: the Producer Price Index and Retail Sales. Yet on Tuesday, the market calmly ignored those reports too. How can we explain the initial ignoring of "dollar" reports and then of the "British" ones? If the market is biased toward buying the dollar, why does it ignore favorable data for it? If it is not, why ignore the British data? Why does volatility remain "below the floor," if the market at least reacts to something? Indeed, there is plenty to react to — 2026 has not been short of events.
Of course, any market move can be explained by the standard phrases "rise in risk appetite" / "rise in risk aversion." If the dollar rises, it's a sign of risk aversion. If it falls, the opposite. We do not subscribe to that view and believe that if moves are illogical, it is better to admit it and identify the factors that actually work at the moment. Those factors now are technical — and not even specifically for the pound.
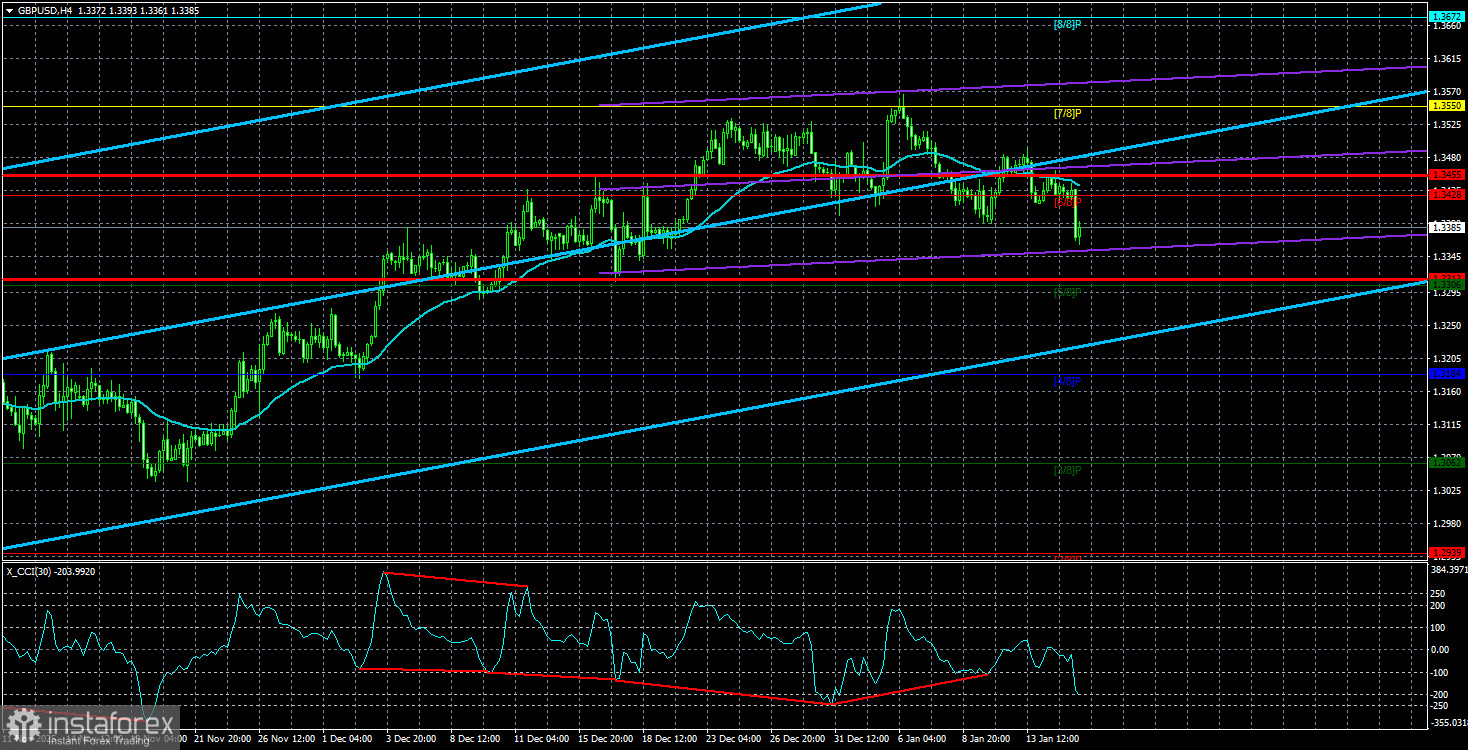
On the daily TF, the pound made the first step toward the resumption of the 2025 global uptrend — it closed above the Ichimoku cloud and the Kijun-sen line. Why does the pair not continue to rise? Because the pound is strongly correlated with the euro. The euro ran into the upper boundary of the daily sideways channel 1.1400–1.1830 several weeks ago, failed to break it, and has since been falling at roughly 10 pips per day. The pound cannot rise without the euro when fundamentals and macro data are practically identical. Therefore, the pound falls along with the euro. This is the only reasonable explanation for what is happening in the market.
We stress again: if a strong drop were occurring now, it could legitimately be interpreted as a reaction to geopolitical events (and even then with reservations). But both currency pairs are showing the lowest volatility in many years. In other words, few trades are being executed, and volumes are minimal. The market simply does not want to trade now or is waiting for a convenient moment for a trend.
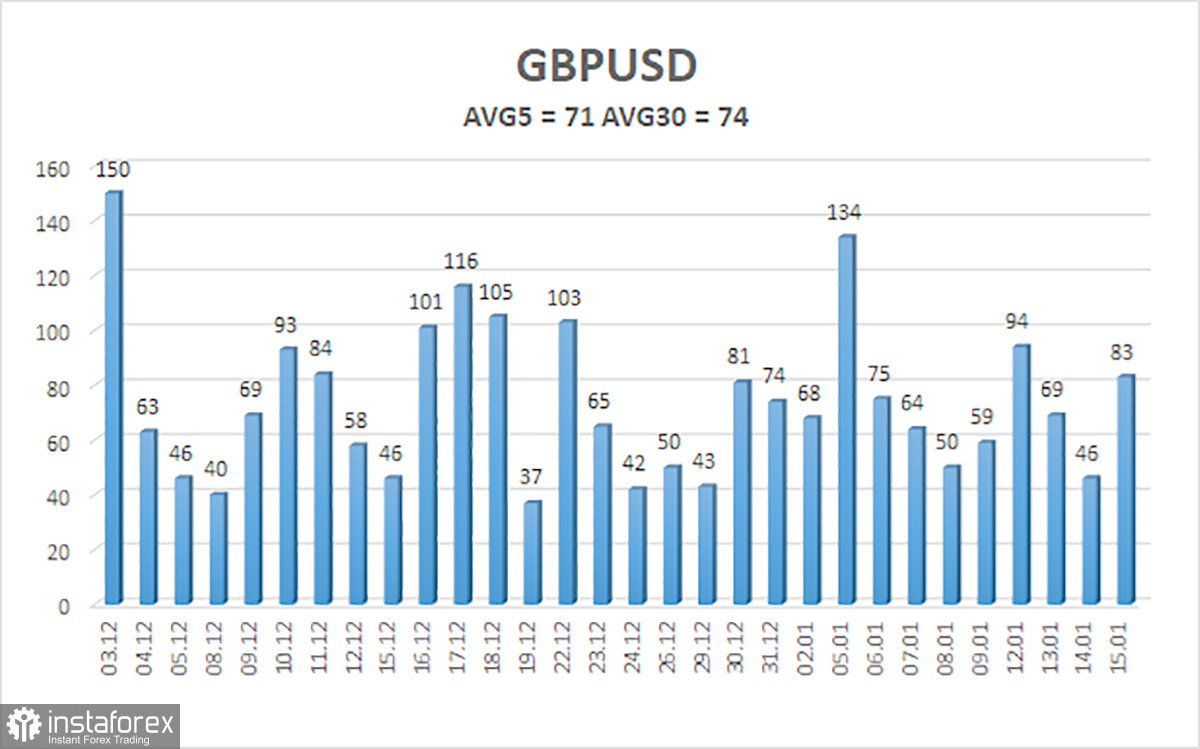
The average volatility of the GBP/USD pair over the last 5 trading days is 71 pips. For the pound/dollar pair, this value is "medium." On Friday, January 16, therefore, we expect movement within a range bounded by levels 1.3313 and 1.3455. The higher linear regression channel has turned upward, indicating trend recovery. The CCI indicator entered the oversold area six times over recent months and formed many "bullish" divergences, which repeatedly warn traders of a continuation of the uptrend.
Nearest support levels:
S1 – 1.3306
S2 – 1.3184
S3 – 1.3062
Nearest resistance levels:
R1 – 1.3428
R2 – 1.3550
R3 – 1.3672
Trading recommendations:
The GBP/USD pair is attempting to resume the 2025 uptrend, and its long-term outlook has not changed. Donald Trump's policies will continue to put pressure on the US economy, so we do not expect the US currency to strengthen. Thus, long positions with targets at 1.3550 and 1.3672 remain relevant in the near term while the price stays above the moving average. A price below the moving average line allows considering small shorts with a target of 1.3313 on technical grounds. From time to time, the US currency shows corrections (in the global sense), but for a trend to strengthen, it needs global positive factors.
Explanations of the illustrations:
- Linear regression channels help determine the current trend. If both are directed the same way, the trend is strong.
- The moving average line (settings 20,0, smoothed) indicates the short-term trend and the direction in which trading should proceed.
- Murray levels are target levels for moves and corrections.
- Volatility levels (red lines) indicate the likely price channel in which the pair will trade over the next 24 hours based on current volatility.
- CCI indicator — its entry into oversold territory (below -250) or overbought territory (above +250) signals an approaching trend reversal.